


Almost every distributed IT team already has data. Spreadsheets, reports, some legacy dashboard inherited from a vendor. And yet, when the CFO asks how many devices are unassigned or how many laptops are due for refresh this quarter, the answer arrives late and with an asterisk. The problem is rarely a lack of data—it's a lack of the right indicators.
In an operation with devices spread across multiple countries, measuring what's easy instead of what matters carries a silent cost. Assets nobody decommissions, ghost devices still generating storage fees, refresh cycles planned by gut feel. None of those problems show up on a generic "total device count" dashboard.
This article isn't about which platform to buy. It's about what to measure before you choose one: the dashboards and management indicators that actually drive a decision, and how to tell them apart from the ones that just fill a screen.
Why having data is not the same as having visibility
The distinction seems obvious—and yet it's exactly what separates a dashboard people use from one people glance at. Collecting data is cheap; turning it into a decision is the hard part. Harvard Business School Online frames it in similar terms: competitive advantage doesn't come from accumulating data, but from the ability to use it to decide with evidence instead of intuition (HBS Online).
In IT asset management, this translates into a simple test. For every indicator on your dashboard, ask yourself: what action changes if this number goes up or down? If there's no answer, the indicator is decorative. "Total devices" almost never passes the test. "Devices with no assigned owner" almost always does: that number triggers a recovery or reassignment action.
The lack of actionable visibility has measurable consequences. Industry analysis shows that without clear metrics, asset management becomes reactive (Proactivanet). The same principle applies to physical inventory: KPIs are only useful when compared against a target and a baseline, not when viewed in isolation (MRPeasy).
Which indicators belong in a dashboard that actually anticipates problems
A good IT asset dashboard prioritizes a small number of indicators that trigger action—not dozens that merely describe the past. These are the ones that move the needle for an operations manager or IT lead with executive reporting responsibilities.
| Indicator | What it anticipates | Action it triggers | |---|---|---| | Inventory status (active / in storage / in repair / decommissioned) | Real available capacity vs. nominal inventory | Reassign before purchasing | | Unassigned assets | Idle capital and storage fees still accumulating | Recovery or reassignment | | Devices approaching refresh | Unplanned spending and logistics spike | Phased budgeting and purchasing | | Days in storage | Idle devices still generating fees | Redeploy or buyback | | Serial-level traceability | Where each device is and who has it | Audit and compliance |
Every row shares one property: the number has an owner and an action. A dashboard that doesn't assign an owner and an action to each metric generates meetings, not decisions. That's the difference between a report and a management indicator.
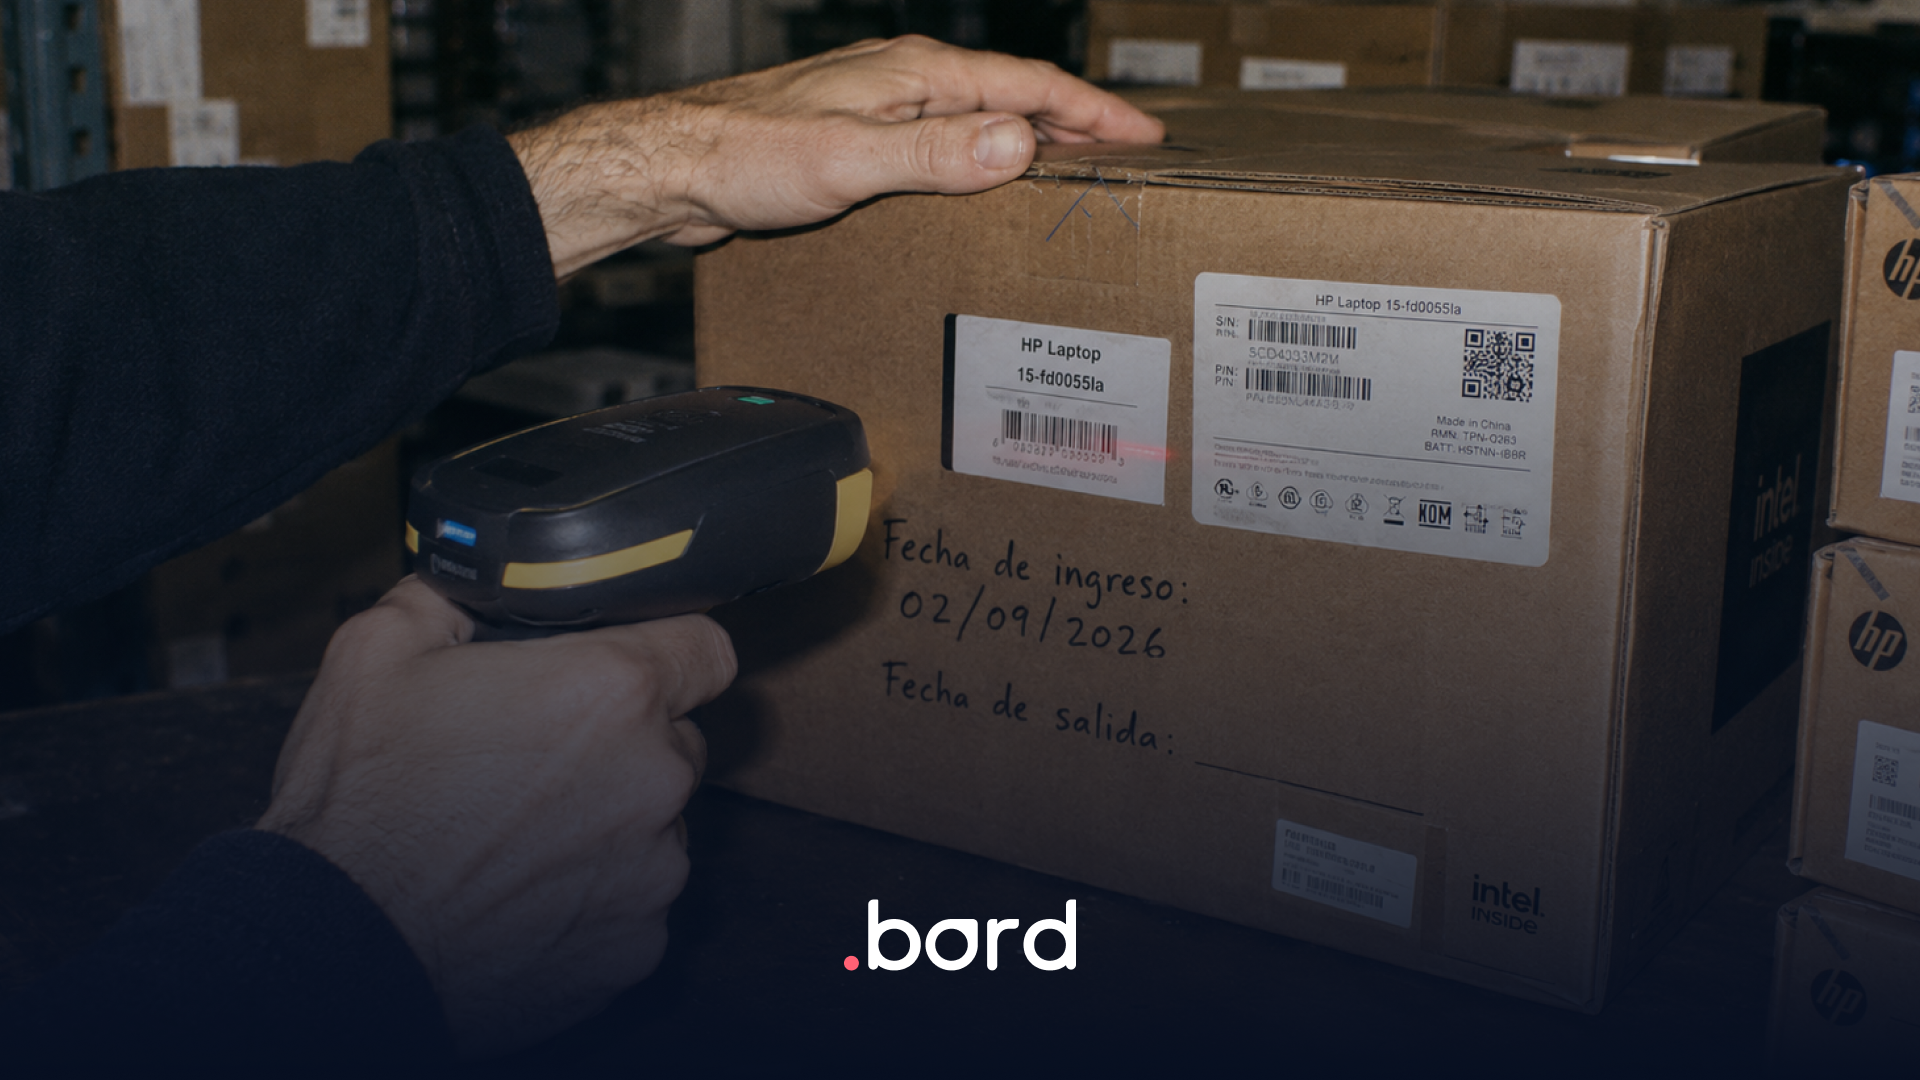
The last row is the most demanding of the five. Traceability isn't just knowing where a device is—it means tracking at the serial number level, maintaining a record of who it was assigned to, and having visibility into what stage of its lifecycle it's in. Without all three together, audits get answered manually.
Inventory status: the unified record as a foundation
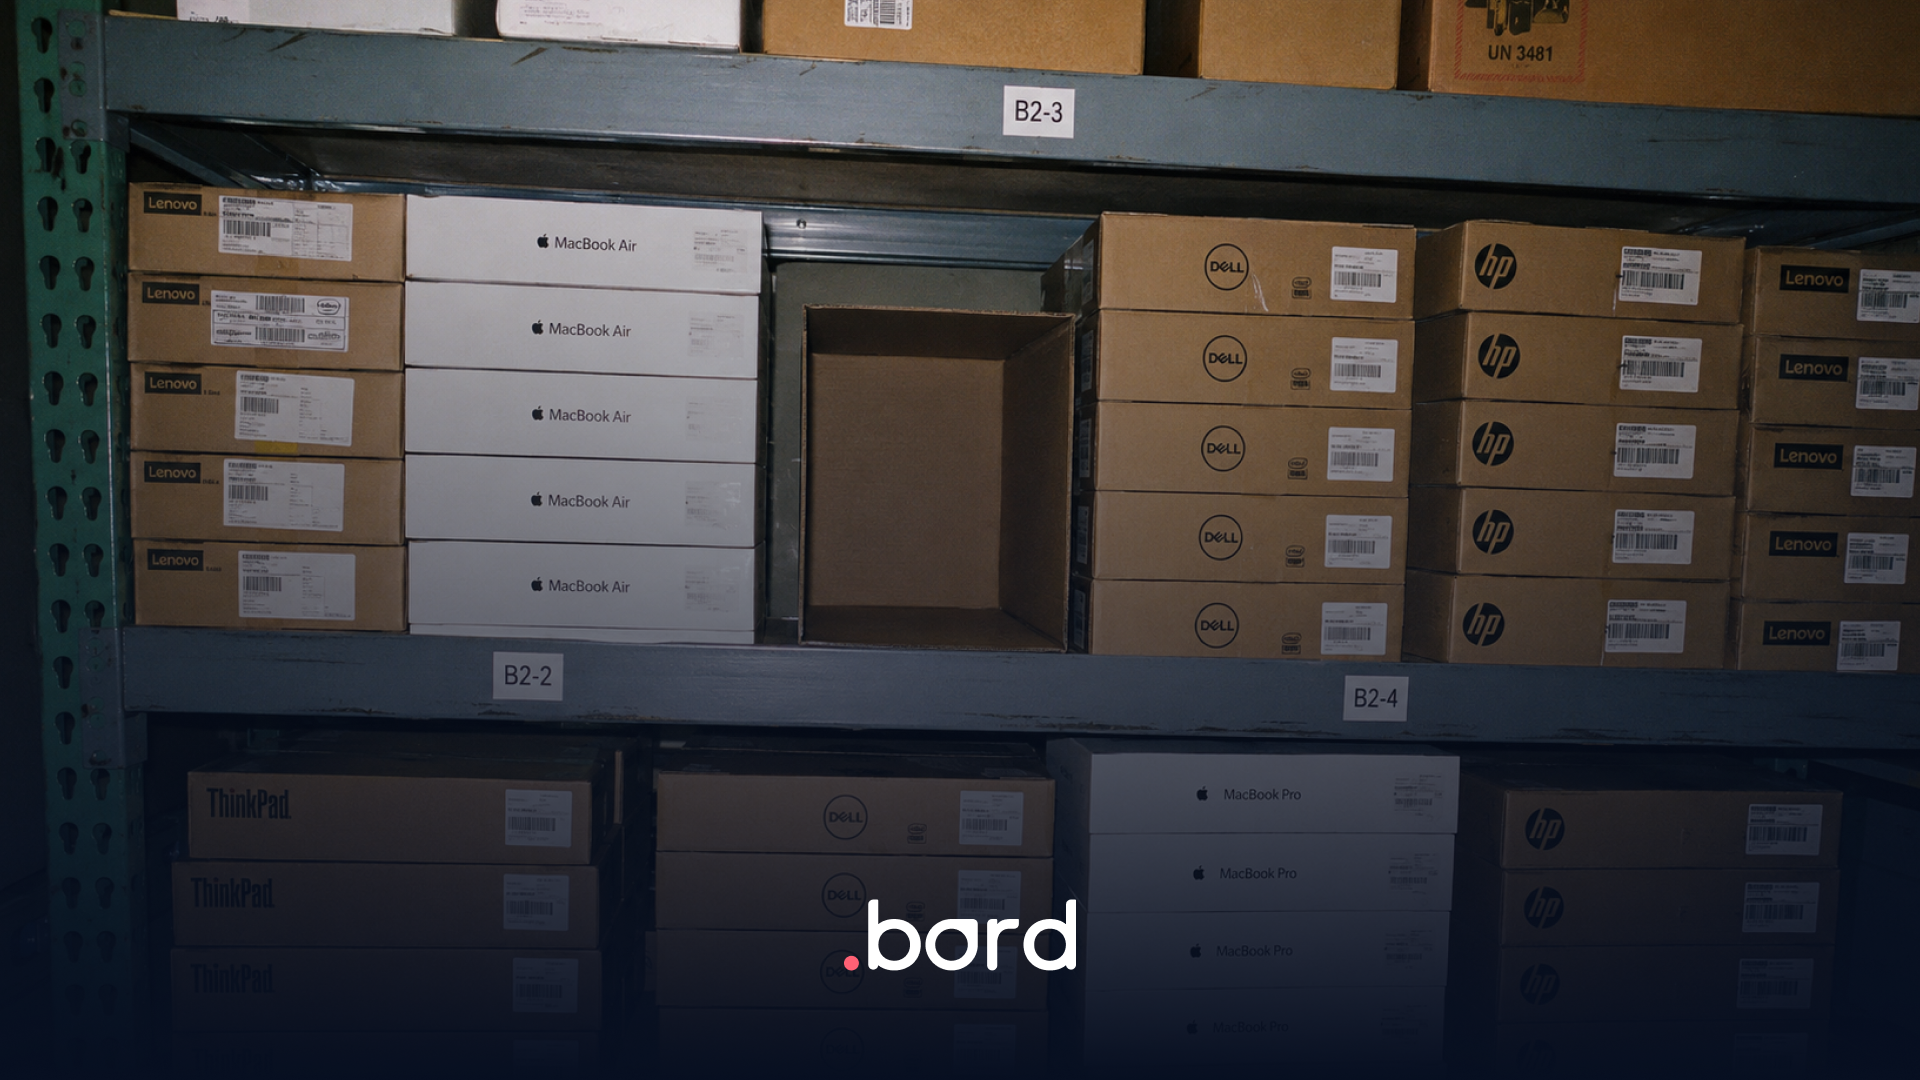
No indicator works on dirty data. The starting point is a unified record where every device has a normalized model, serial, category, location, and owner. Blind inventory—asset data scattered across disconnected spreadsheets and platforms—is one of the four typical costs of distributed growth, alongside vendor fragmentation, local coordination overhead, and lifecycle complexity. When data is fragmented, the dashboard inherits that inconsistency: ghost assets appear, duplicates emerge, and ownerless devices pollute every executive report.
Data normalization—homogenized models, serials, and categories—along with alerts for inconsistencies, is what separates a dynamic, reliable inventory from a spreadsheet that ages poorly. Bord distinguishes between external assets (those loaded by the customer, purchased from any vendor) and Bord assets (those purchased through the platform). Both live in the same inventory, under the same data model: each unit has a Product ID and a serial number. That normalization is what makes an operational dashboard reliable rather than decorative.
Unassigned assets and days in storage: the cost nobody sees
Two of the highest-value KPIs look at idle inventory. An unassigned device is immobilized capital; a device in storage accumulates days in storage—calendar days since intake—and, depending on the model, a recurring storage fee. In a distributed operation, those two numbers together typically reveal more savings potential than any purchase price negotiation.
Detecting idle inventory in time is precisely what turns those numbers into action: finding out at the end of the quarter that twenty laptops were sitting idle doesn't help. A device detected early gets redeployed to the analyst starting Monday in Bogotá, instead of triggering a new purchase—and that decision only exists if the dashboard surfaces it while there's still time to act.
Devices approaching refresh: planning the spike before it hits
Refresh is the only large spending event that can be anticipated with certainty: a device purchased today will need replacement within a known horizon. A dashboard that flags which devices are entering their refresh window in the next six or twelve months turns a budget spike into a phased purchase. Without that indicator, refresh gets discovered when devices are already failing—and then the purchase is urgent, without negotiation and without a logistics plan.
What dashboards should NOT be on your IT asset panel
The opposite mistake is equally costly: filling the dashboard with charts that look good but decide nothing.
- Aggregate counters without breakdown: "1,240 devices" without a split by status, country, or owner. Impressive, not actionable.
- Historical charts without thresholds: a 24-month purchasing trend is context, not an alert.
- Metrics with no owner: if nobody is responsible for moving the number, the indicator is decoration.
- Platform vanity metrics: "weekly logins" says nothing about inventory health.
The rule mirrors the earlier sections: if the indicator doesn't trigger an action with an owner, it comes off the dashboard. Data visualization exists to help you decide faster, not to fill a screen at the end of the quarter.
A 4-question framework before choosing your IT asset dashboard
Before comparing platforms, define what you need to measure. This checklist structures the decision:
- What executive decisions depend on inventory? Refresh, budget, compliance, recovery. Those decisions define your indicators—not the other way around.
- Can I assign an owner and an action to each metric? If not, it doesn't go on the dashboard.
- Does the record update automatically or manually? The concrete question: does a device's record change when it enters or leaves storage, or only when someone remembers to update it? Model, serial, location, and owner must be normalized, with alerts for inconsistencies (ghost assets, duplicates, ownerless devices).
- Do I have real-time visibility or delayed reports? A dashboard that updates at month-end anticipates nothing.
Answering these four questions before watching demos avoids the most common pattern: buying a powerful dashboard and filling it with metrics nobody uses. The right platform is the one that answers your questions—but first you have to have the questions.
It's entirely possible to have full visibility and traceability of all technology assets from a single platform. But the platform is the second step. The first is knowing what to measure.
Frequently asked questions
What is an IT asset dashboard and what is it used for?
It's a centralized view that consolidates the status, location, and owner of every company device, with live tracking of deployments and retrievals. It's used to anticipate decisions: how many devices are unassigned, which ones are approaching refresh, and how many are accumulating days in storage. A good dashboard doesn't show total device count—it shows the indicators that trigger a concrete action with a responsible owner, rather than descriptive reports that only summarize the past.
What are the most important IT asset management KPIs?
The ones that anticipate a problem and trigger an action: inventory status (active, in storage, in repair, decommissioned), unassigned assets, devices approaching refresh, days in storage, and serial-level traceability. Each one must have an owner and an associated action. Aggregate counters without breakdown or historical charts without thresholds are usually decorative—they look good, but they don't change any decision.
What is the difference between having inventory data and having actionable visibility?
Having data means accumulating spreadsheets and reports; having actionable visibility means being able to decide with them in real time. The test is simple: for each indicator, ask what action changes if the number goes up or down. If there's no answer, the data point is decorative. Actionable visibility requires a unified, normalized record—model, serial, location, and owner—because no dashboard is reliable when built on dirty data.
Do I need a platform before defining my IT inventory KPIs?
No. The correct order is the reverse: first define which executive decisions depend on inventory (refresh, budget, compliance, recovery), then determine which indicators feed those decisions, and only then choose the platform that displays them. Buying a powerful dashboard and filling it with metrics nobody uses is the most common mistake. The platform should answer your questions—but first you need those questions clearly defined and with an assigned owner.
Quick summary
A useful IT asset dashboard doesn't show total device count: it shows the indicators that anticipate a decision. Inventory status, unassigned assets, devices approaching refresh, and serial-level traceability are the KPIs that drive action; everything else is usually decorative noise.
Want to see what your IT inventory looks like in a single dashboard, with live tracking of every device? Schedule an asset tracking and management demo with Bord.